Back to Table Of Contents
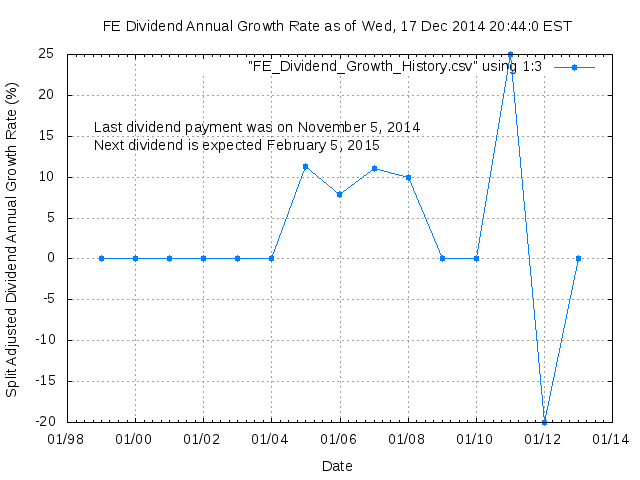
Dividend Growth Rate, min = 0.00% per year, mean = 3.09% per year, std. dev. = 1.56%, "Sharpe Ratio" = 1.98
The "Sharpe Ratio" is calculated as the ratio of the mean dividend growth rate divided by its standard deviation. This assumes that the dividend growth rate of a risk free investment is 0. The higher the "Sharpe Ratio" the better. It is stretching the definition of the real Sharpe Ratio to apply it in this way.
Back to Table Of Contents
|
 |
 |
Dividend Growth Rate, min = 0.00% per year, mean = 3.09% per year, std. dev. = 1.56%, "Sharpe Ratio" = 1.98
 |
 |
Back to Table Of Contents
Back to Table Of Contents